Building your data dashboard begins with adding widgets to your dashboard that are particular to a specific data source and visualization.
Adding Widgets
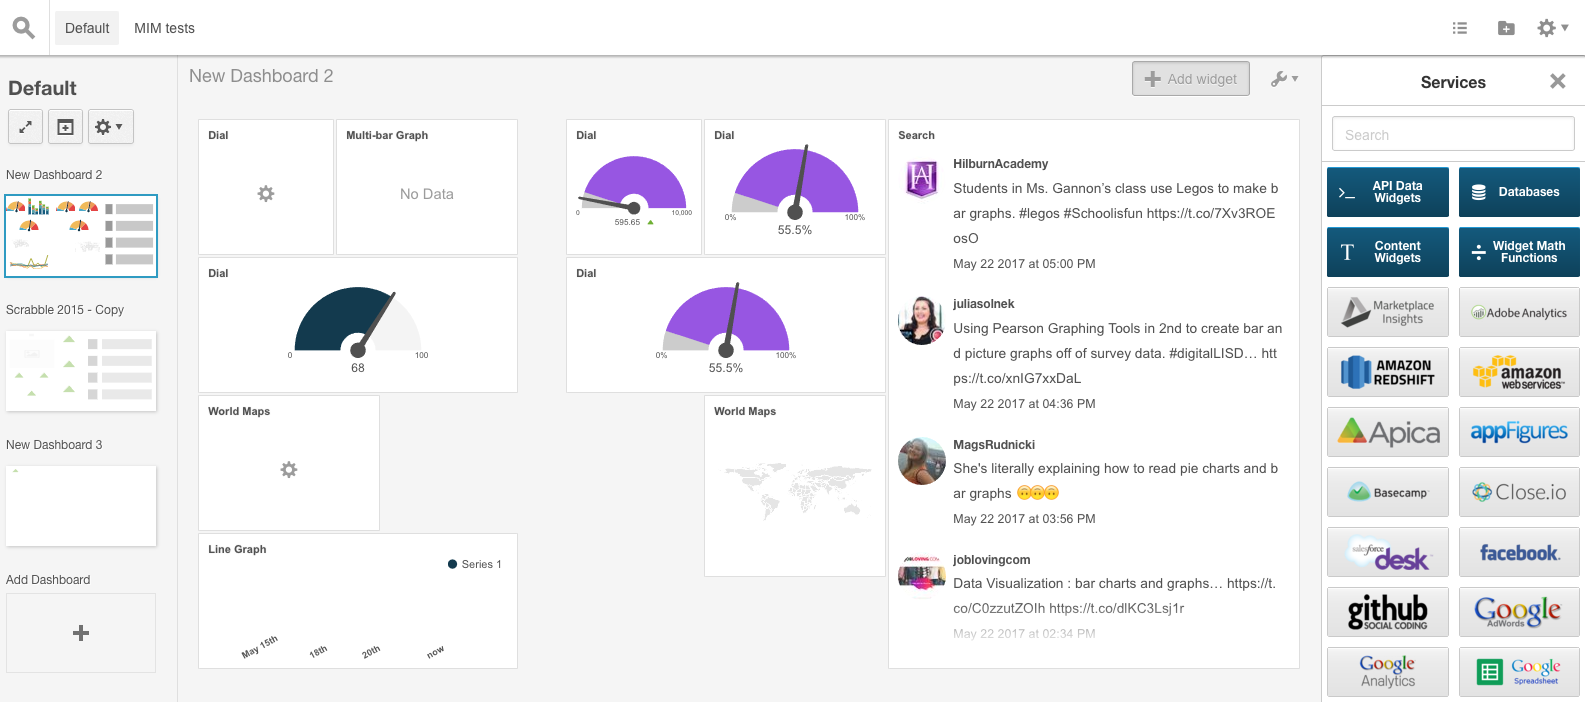
Every dashboard has an "Add Widget" button. When it is sellect, it will open up the services panel, a comprehensive list of all the data sources that you can connect to. Selecting a data source will open up further panels where you can select a specific metric and a visualization type to display that metric.
The Navigator
As you build more dashboards and create folders, you can rely on the navigator to search, view, and organize you dashboards into meaningful reports.
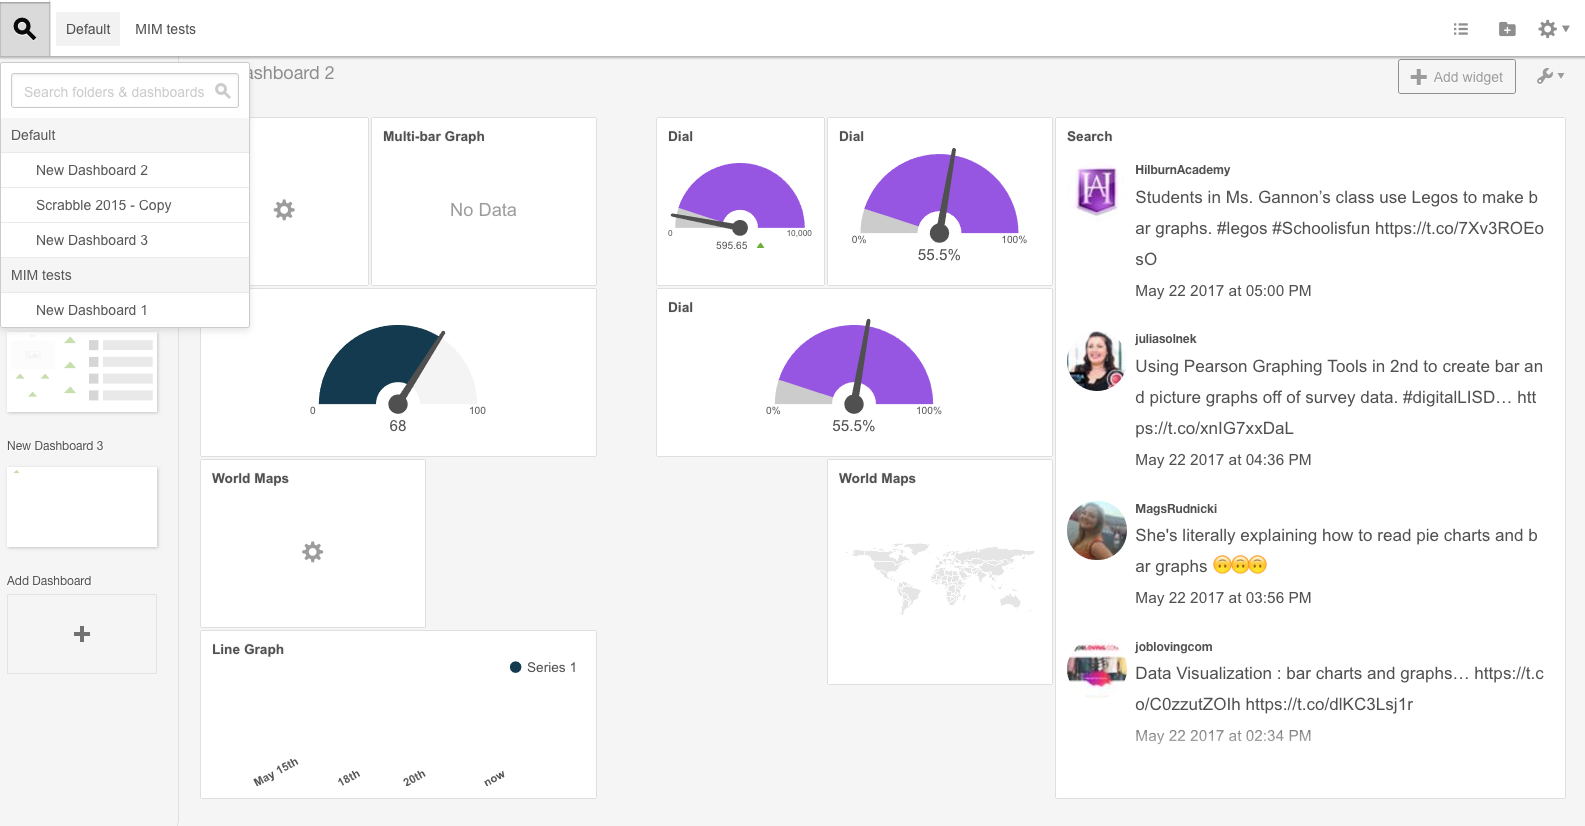
Click on the spyglass icon and a dropdown will appear containing your dashboards sorted by the folders they belong to. You can use the search bar to find things by key words and clicking on the dashboard will bring up that dashboard. You can also click on a dashboard thumbnail in the Folders Panel and drag and drop it into a folder from the Navigator dropdown and move the dashboard into that folder.