While AppInsight’s third party integrations are intended to streamline the process of surfacing your company’s KPIs, it’s possible that you’re in the habit of organizing some portion of your company data in spreadsheet format. With this in mind, we’ve made it possible for users to easily populate their dashboard widgets with our CSV upload tool which treats data from an Excel file like a set of active data streams.
For users that are new to our CSV upload tool, we recommend you read this tutorial in full.
OVERVIEW
For each widget that you would like to populate using the CSV upload tool you’ll have to follow a number of steps:
- Add a blank widget to your dashboard
- Create / save widget data stream identifier
- Format / save your .csv spreadsheet
- Upload your spreadsheet
We will outline these steps below, and then provide you with the necessary information for populating all of our various visualization types. Let’s use our basic number widget for the purposes of this sample workflow...
ADD A BLANK WIDGET TO YOUR DASHBOARD
The first step to using our CSV upload tool is choosing the widget(s) that you would like to populate with data. Start by navigating to the services panel on the right side of the app ("+ Add Widget" button) and selecting the “API Data Widgets” tile.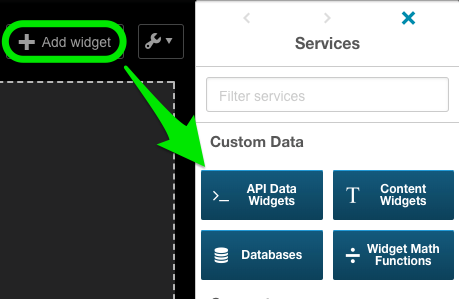
As the CSV upload tool will be “pushing” data into AppInsights using custom stream identifiers, you’ll want to select the “Push Data” option and then select the visualization you’d like to use. 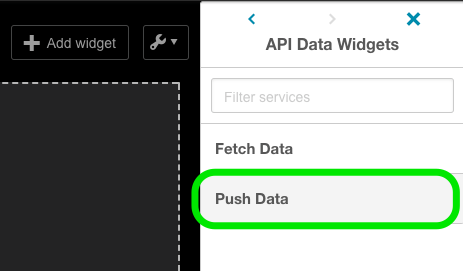
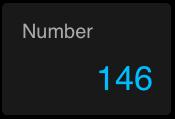
For our example, we’ll select our standard number widget: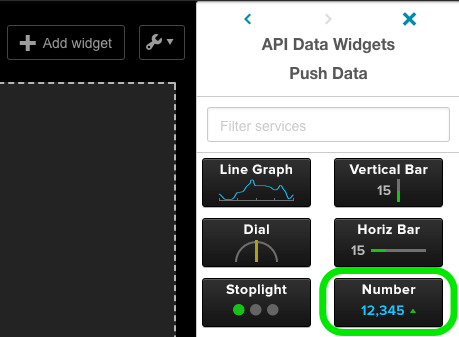
Once you’ve selected your visualization, a new widget will appear on your dashboard ready to be configured. To find the unique stream identifier that will allow you to populate your widget, hit the gear icon and select the “Edit Widget Settings” menu. 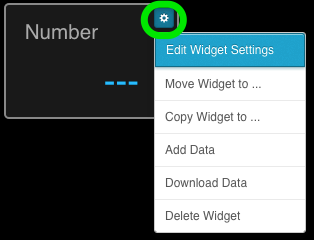
CREATE / SAVE WIDGET DATA STREAM IDENTIFIER
Within the “Edit Widget Settings” menu, you will default to the “Data Settings” tab where you will immediately see the unique stream name that has been generated for you widget. You can either use the randomly generated stream code that appears, or you can replace it with a custom name that you create. Please note: you cannot use the same stream name for multiple widgets, so be sure to keep track of any custom stream names you create to avoid confusion. Widget stream names are case-sensitive.
Once you’ve specified your stream name, make sure to hit the blue “Save” button so that your widget records the stream name you’ve specified.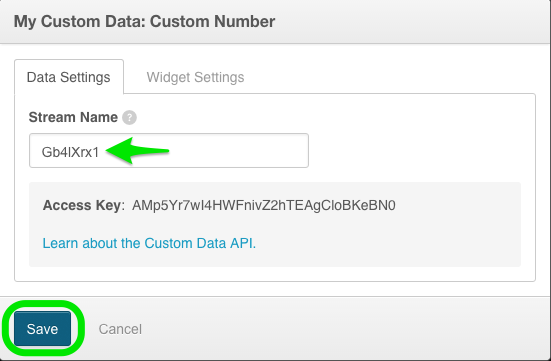
Now that you have your widget stream name, you’ll need to add this reference to your spreadsheet in order for the data upload to be successful.
FORMAT / SAVE YOUR .CSV SPREADSHEET
For each widget type, there are “data keys” that will allow you to point out what spreadsheet data you would like to use to populate various parts of your widget. Each widget key must then be preceded by the data stream identifier we generated in our previous step.
Standard number widgets only have a single data key called “number”. The number key will communicate to AppInsights which spreadsheet cell you would like to use to populate the main value of your number widget. Here is the ideal organization of your spreadsheet data for a single number: Stream Name, then Key, then Data.
UPLOAD YOUR SPREADSHEET
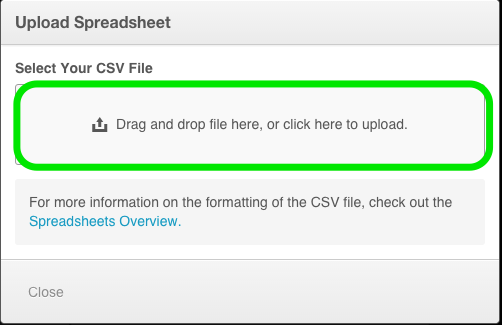
Once you’ve saved your spreadsheet in CSV format, you can take the final step of uploading your spreadsheet to AppInsights. Just select the "Settings” menu (wrench icon) in the top right corner of the relevant dashboard and open the “Upload Spreadsheet” menu. From there, you can browse to upload your file -- a successful upload will yield a “Success!” message across the top of your dashboard environment, and you’ll notice that your widgets are now populated.
Please note: our CSV upload tool will not accept a file with the standard Excel extension, “.xls”. Instead, be sure to save your spreadsheet in the Comma Separated Values (CSV) format, which will strip your spreadsheet of any uncooperative custom styling or formatting.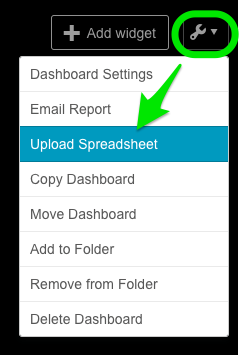
As long as you do not change your data stream identifier, you can continue using the same spreadsheet to update your widget. Simply update your data, save the .csv, and follow the upload process once again. Any existing widget value will immediately be overwritten by the new spreadsheet value.
Please note that our CSV upload tool will allow you to populate multiple widgets using the same spreadsheet. Simply arrange your data in adjoining columns and ensure that your widget data streams and keys are matched with the correct corresponding columnized data. Read on for further clarity on how to organize your data for each visualization type.
KEYS BY WIDGET
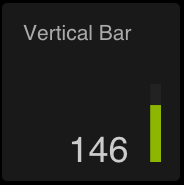
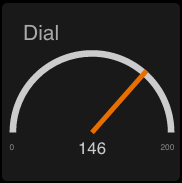
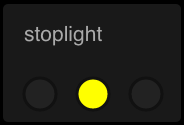
- Horizontal Bar, Vertical Bar, Dial, Stoplight
- Line Graph, Sparkline
- Leaderboard, Pie Chart, Bar Graph
- List
- XY Graph
- Table
- Multi-bar
The remainder of this tutorial will provide the unique keys for each widget type. Please note that the workflow for each widget will mirror the steps in our example above. For widgets with multiple keys, you will simply need to repeat the stream identifier at the top of your spreadsheet and organize your data in adjoining columns (screenshots below).
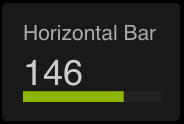
Horizontal Bar, Vertical Bar, Dial, Stoplight
“number” -- primary numerical value used to populate widget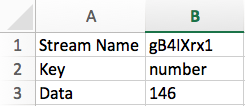
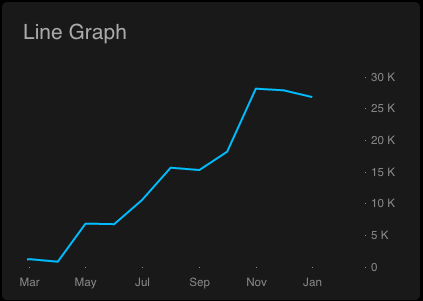
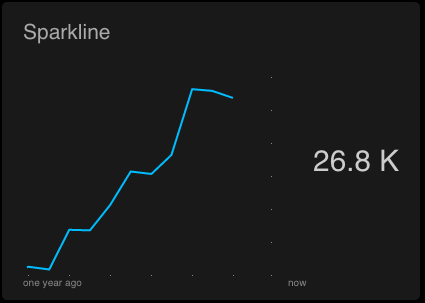
Line Graph, Sparkline
“timestamp” -- determines time period along the x-axis; yyyy-mm-ddThh:mm:ssd format required
“number” -- numerical values used to plot line along y-axis
“prefix” -- specify a symbol to immediately precede your data values (not shown in sample below)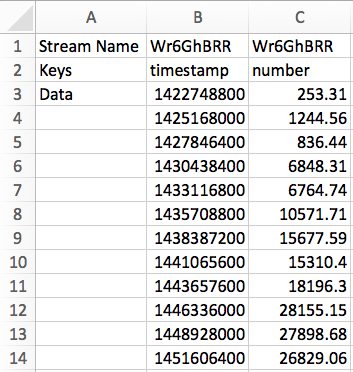
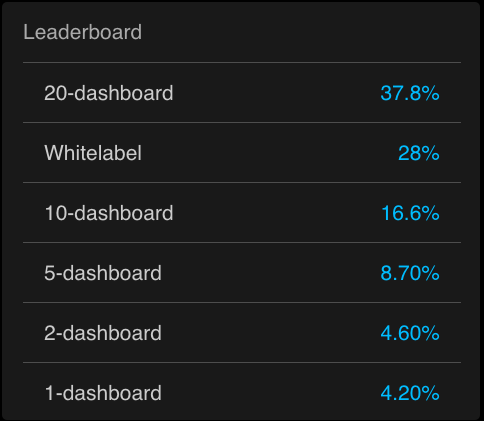
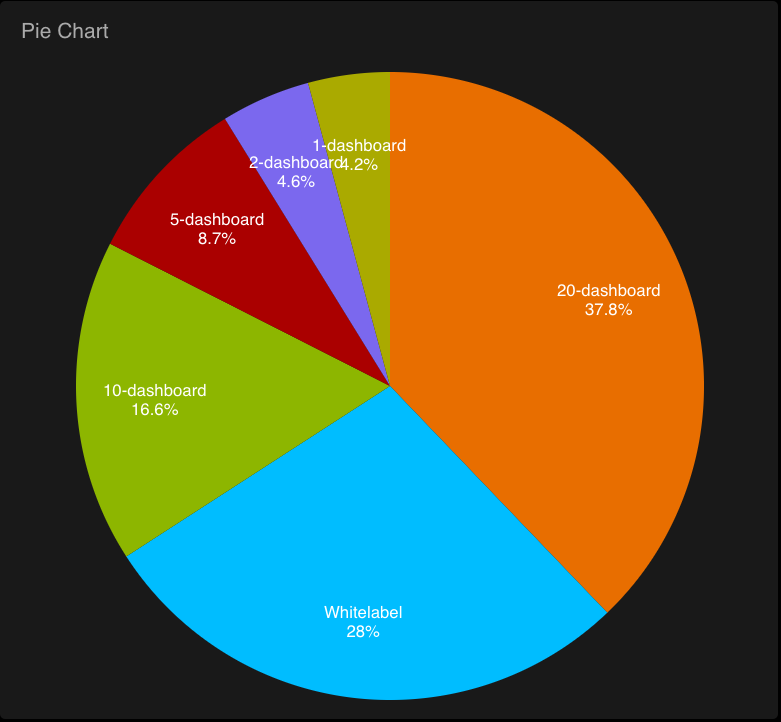
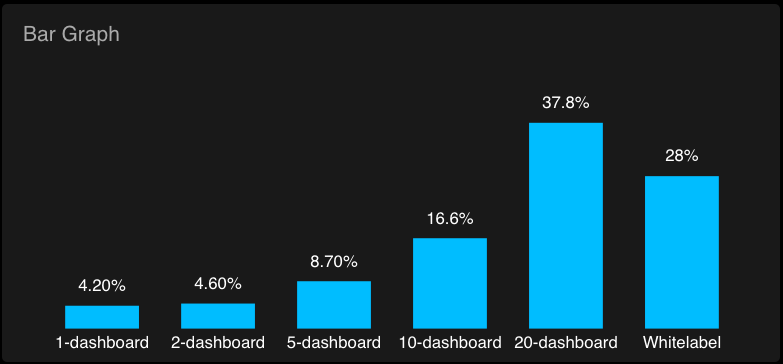
Leaderboard, Pie Chart, Bar Graph
“name” -- text content used to identify leaderboard entry
“value” -- numerical value to accompany name item; widget is dynamically sorted based on these values
“suffix” -- specify a symbol to append to your data values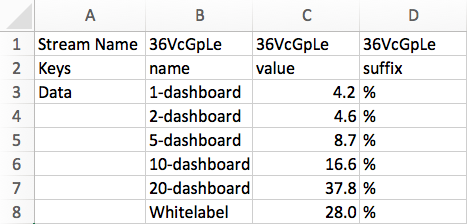
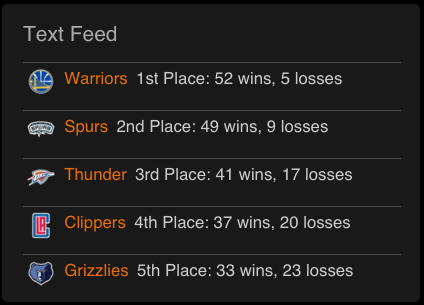
Text Feed
“imgUrl” -- URL for image used to accompany feed item title and message
“title” -- title text for feed item
“msg” -- message / content text for feed item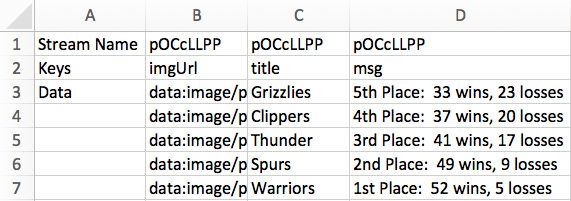
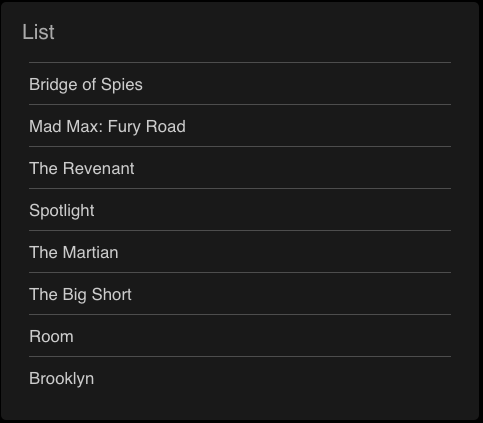
List
“listItem” -- text strings to be represented in your list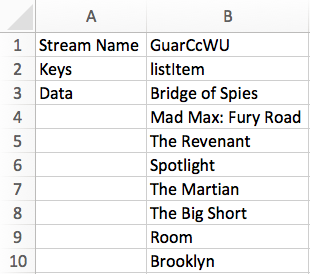
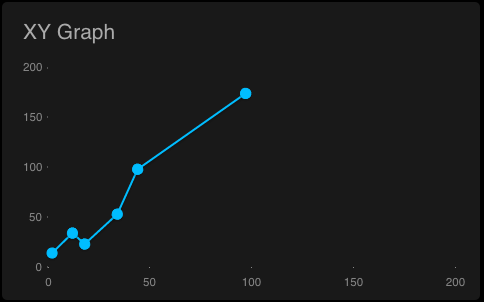
XY Graph
“x” -- numerical values to be plotted on the x-axis
“y” -- numerical values to be plotted on the y-axis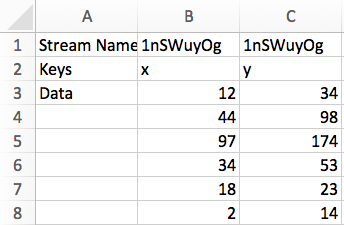
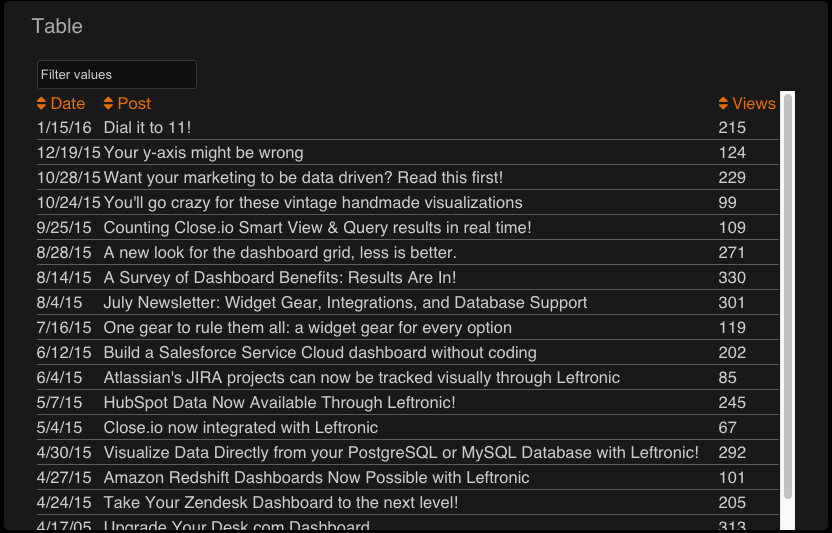
Table
Our table widget is unique in that is does not require specific keys of any kind. Instead, your data stream identifier should be followed by the header or title that you would like to use for that column of data. The table also does not limit the number of columns of data you upload.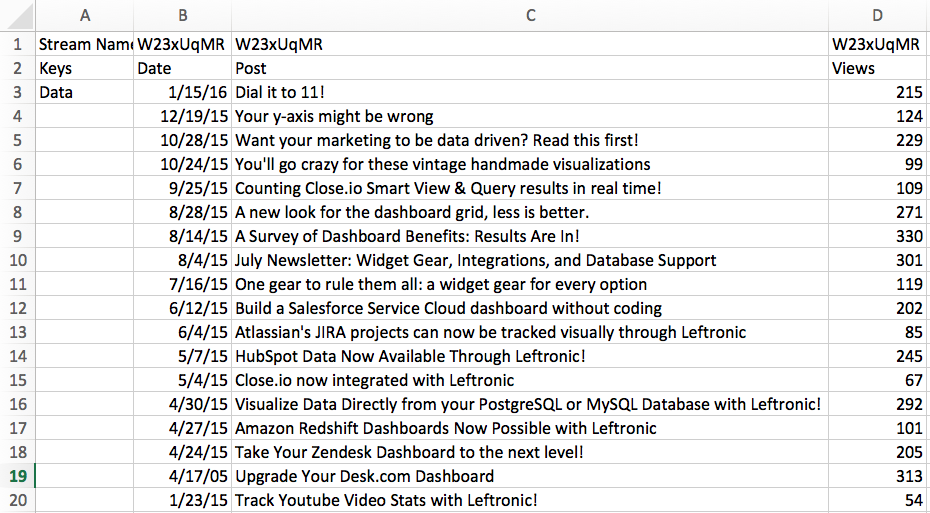
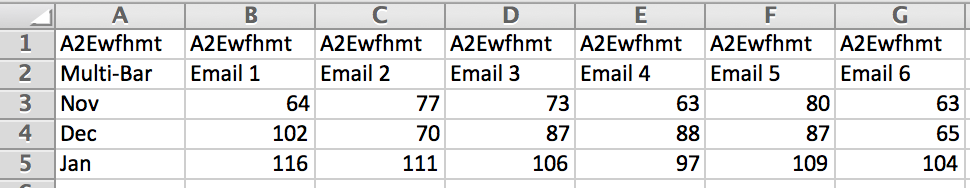
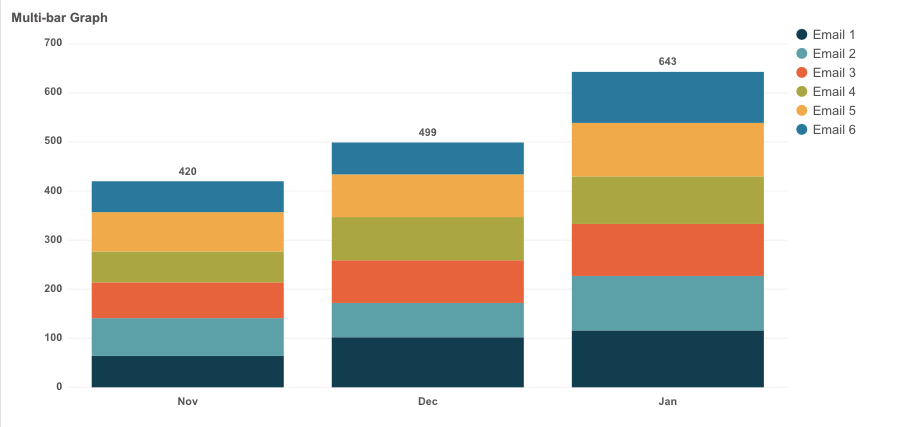
Multi-bar
Similar to our table widget, the multi-bar graph does not require unique keys for different pieces of data. Instead -- because there are multiple dimensions to a multi-bar widget -- you can simply use your category titles in place of keys. (In the sample below, we've used "Email 1", "Email 2", "Email 3", etc.)